Real-time performance analytics dashboard handling 20k req/s.
Inside Real Estate launched Vitals, a daily performance dashboard for every brokerage on BoldTrail. Danubio designed and built the real-time event tracking, scoring, and aggregation service behind it, end-to-end.
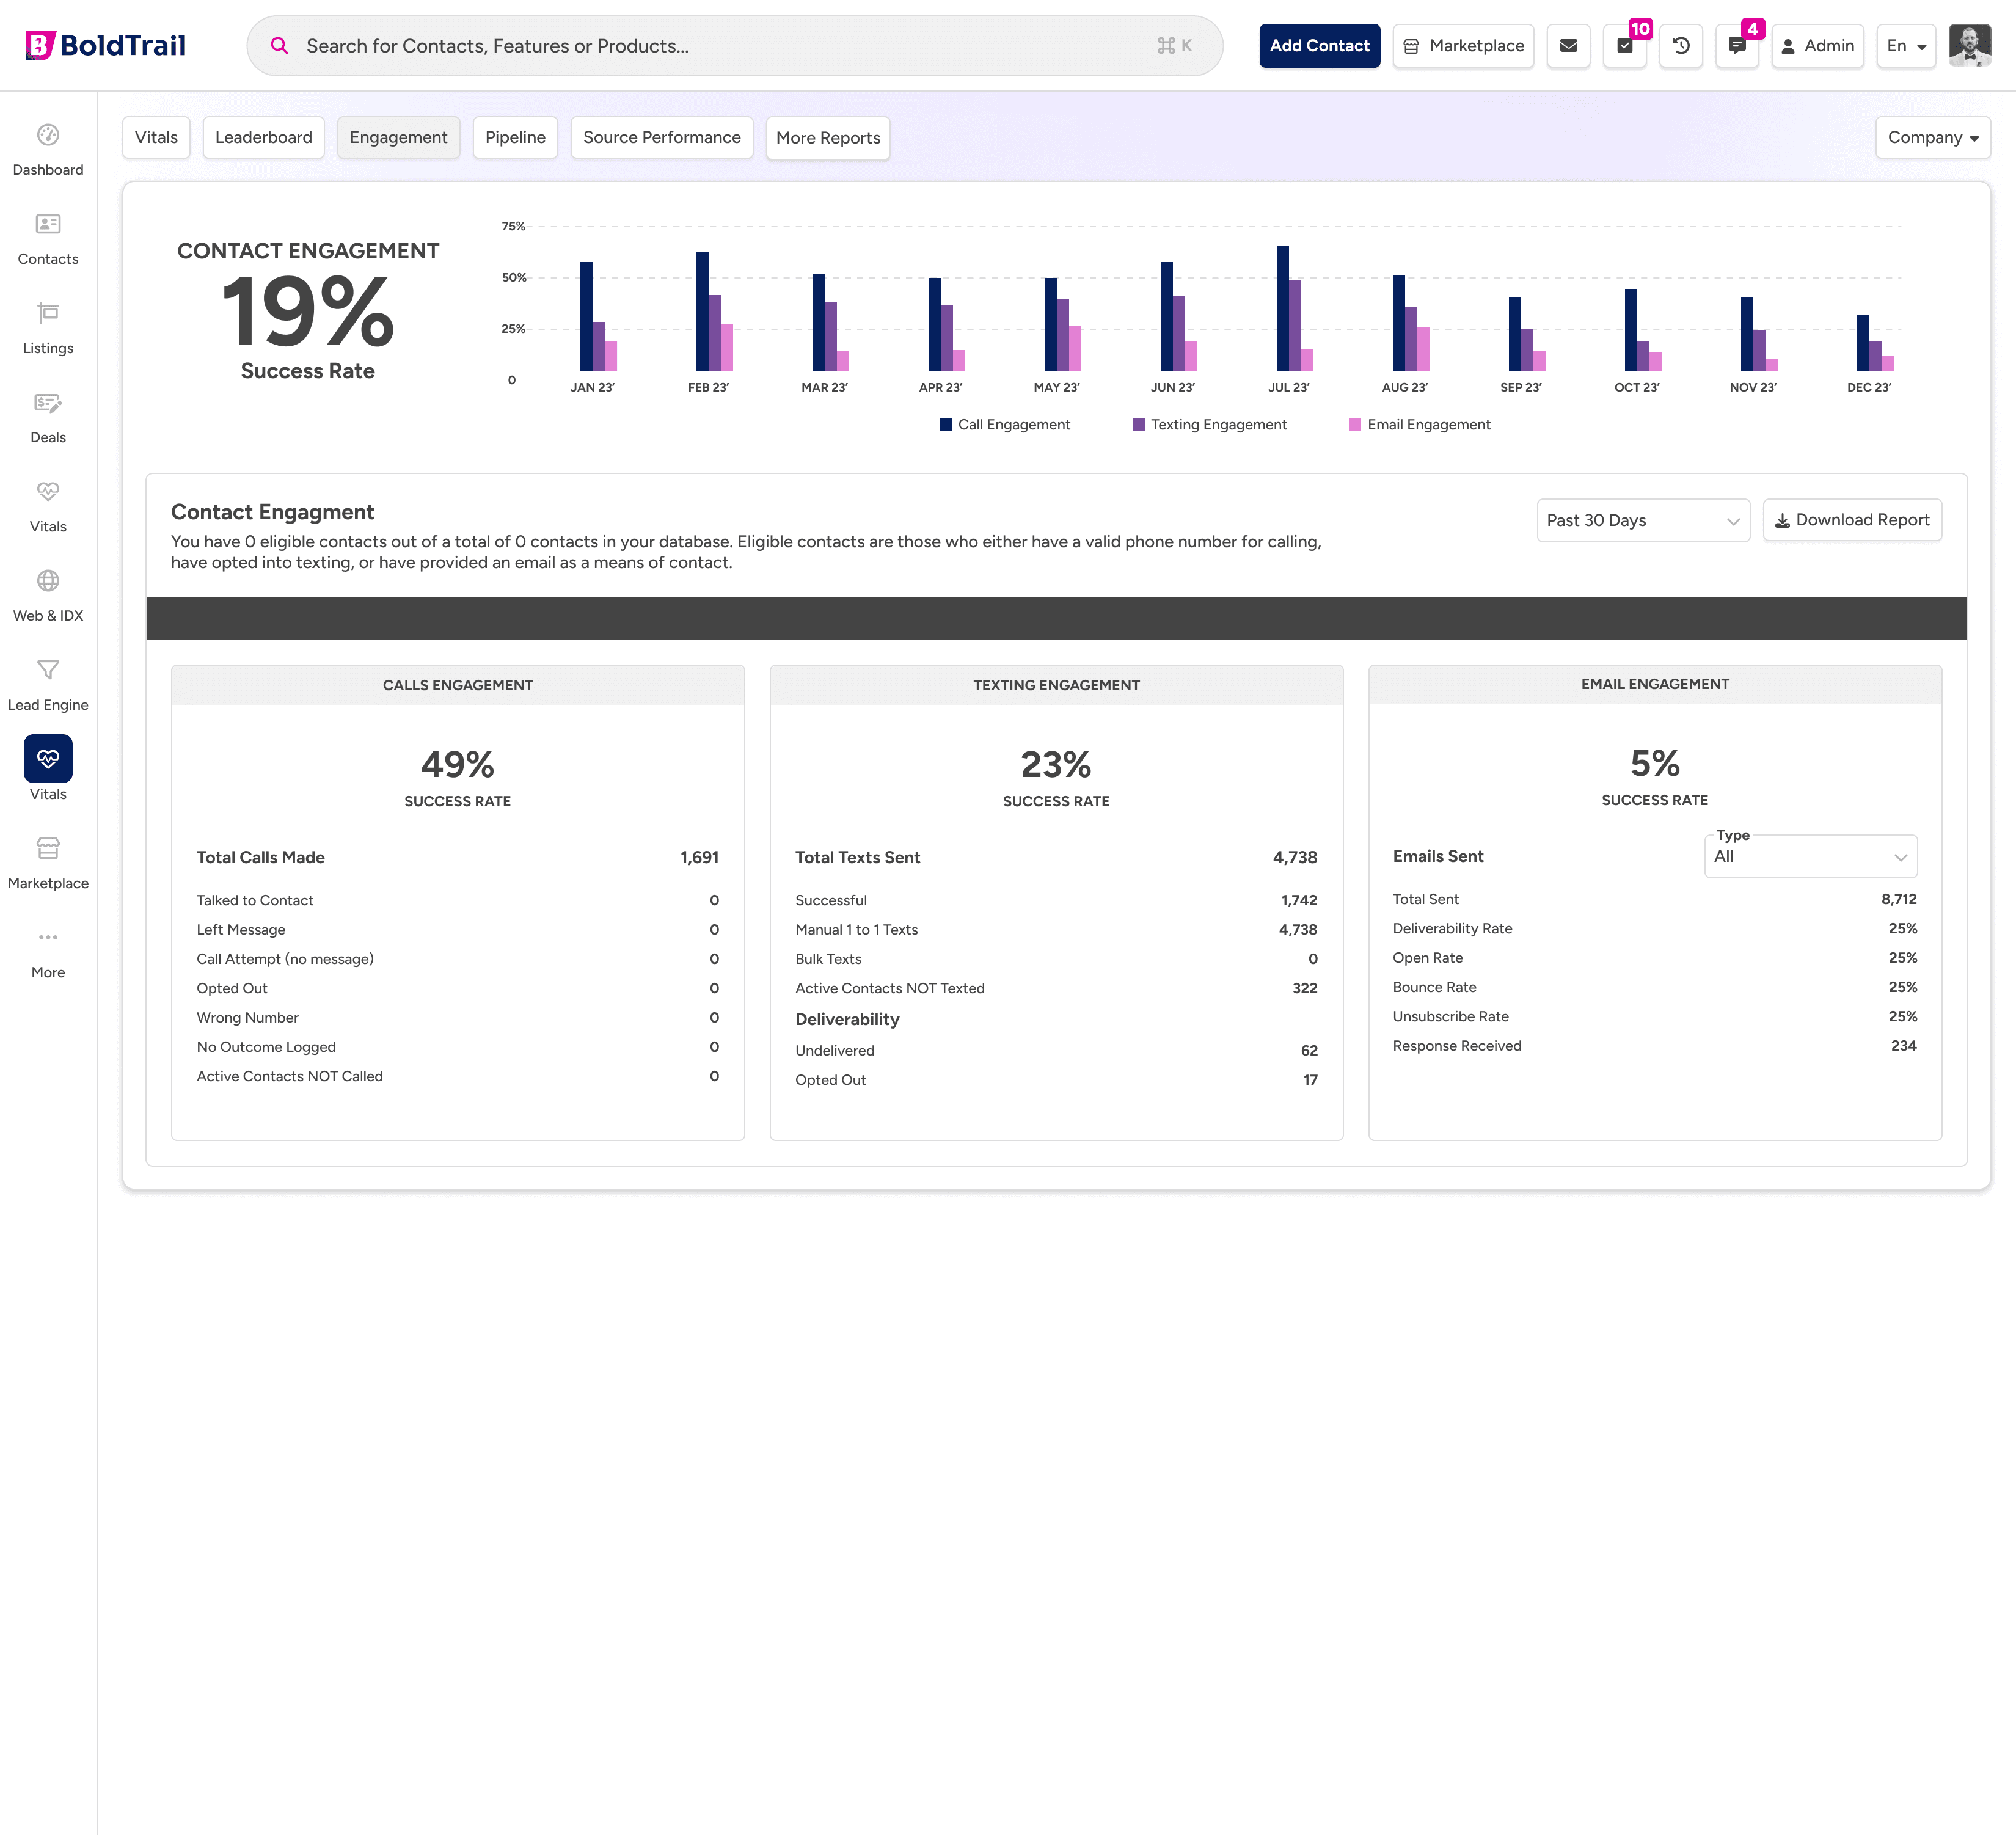
The Vitals scoreboard. Eight KPIs, one score, four scopes, near-real-time.
The situation
Inside Real Estate set out to give every brokerage on BoldTrail a daily performance signal: a single number that surfaces what to act on, ranked by what actually drives engagement. The result, Vitals, computes a Total Vital Score from eight weighted KPIs over a rolling thirty days, and lets brokerage owners, team leads, and individual agents drill from Company down to a single agent.
The constraint was the CRM underneath. BoldTrail serves roughly 400,000 users across major national brokerages, and we could not change how it stored or emitted data without touching the surface every other product team depended on. Six of the eight KPIs are derived rates rather than raw counts, and the score had to be near-real-time, transactionally consistent across rollups, and hold under platform load.
Danubio had been the engineering partner behind BoldTrail product surfaces for years. We took ownership and built the system end-to-end. Vitals launched in February 2025.
Stand outside the CRM. Listen to it.
BoldTrail is the system of record for hundreds of brokerages and roughly 400,000 users. Producing analytics-grade events from BoldTrail itself would have meant compromising the system every product team depended on.
Instead, a Debezium-based change data capture layer reads BoldTrail’s transaction log and streams every change of interest into Kafka. Vitals consumes the stream and reconstructs everything it needs from there, without ever querying the CRM.
Compute the score as events arrive
The score had to be ready before anyone asked for it. Computing it on demand could not have held at platform scale.
So each KPI runs as its own stream of derived events. A microservice watches the CDC stream, joins KPI-moving events with whatever they need to produce the metric, and emits a running value. By the time the dashboard opens, the numbers are already there. No batch reconciliation, no nightly rebuild.
If a producer or connector fails, Vitals reconciles from BoldTrail and rebuilds the affected KPIs. Streaming carries the steady state; reconciliation is there when the streaming path hiccups.
One source, every roll-up
The same score had to roll up across Company, Office, Team, and Agent without drift between them. We built every rollup on the same enrichment events, so the four scopes are the same number aggregated four ways.
The other Vitals surfaces (Engagement, Leaderboard, Pipeline) are different reads of the same data.


What Inside Real Estate said about the Vitals build.
This was a genuinely hard problem: real-time scoring on top of a CRM we couldn't modify. Danubio came up with an elegant solution, and it worked so well that our internal teams have used the same pattern on other initiatives since. Real credit to them.

Peak throughput of 20,000 events per second across the pipeline, with the score moving end-to-end inside three seconds.
- A real-time event tracking, scoring, and aggregation service sustaining 20,000 events / sec at peak
- Total Vital Score and contributing KPIs visible within three seconds of the underlying CRM event
- Score transactionally consistent across Company, Office, Team, and Agent rollups
- CDC and Kafka pipeline adopted by Inside Real Estate’s internal teams for subsequent platform initiatives
“It gives me confidence that each day is as productive as possible for my business.”
Frequently asked questions
What is Vitals?
Vitals is a daily performance dashboard that Inside Real Estate launched for every brokerage on BoldTrail. Danubio designed and built the real-time event tracking, scoring, and aggregation service behind it, end to end. The dashboard gives each brokerage a daily read on how it is performing, which means the system underneath has to ingest a continuous stream of activity events, score and aggregate them accurately, and have the results ready for every brokerage when they look. Danubio owned that entire backend service: the pipeline that captures events, the logic that turns raw activity into the metrics brokerages see, and the aggregation that makes those metrics fast to read. It was built on Kafka and Spring on AWS, with a Vue front end presenting the dashboard.
What throughput does the service handle?
The event pipeline behind Vitals handles around 20,000 requests per second. That throughput is the core engineering challenge of the system: every relevant action across all brokerages on BoldTrail becomes an event the service has to capture, process, score, and aggregate in near real time, without dropping data or falling behind. Danubio built the pipeline on Kafka and Spring on AWS, using Kafka to absorb and stream the event volume reliably and Spring services to do the scoring and aggregation. Sustaining roughly 20,000 requests per second while keeping the daily numbers accurate for every brokerage is what separates a real-time analytics service from a simple reporting query, and it is the part Danubio designed and owned end to end.
What did Danubio own on this engagement?
On the Vitals engagement, Danubio owned the full real-time service end to end: the event tracking that captures activity, the scoring logic that turns it into meaningful metrics, and the aggregation that makes those metrics available per brokerage. That is the entire backend behind the dashboard Inside Real Estate launched on BoldTrail, built to sustain around 20,000 requests per second on Kafka and Spring on AWS. Owning it end to end meant Danubio was responsible for the decisions that make a real-time pipeline dependable, beyond writing the service itself: how events flow, how the system stays accurate under load, and how it keeps up with the volume every brokerage generates. The dashboard itself sits on a Vue front end on top of that service.
Putting real-time data behind a product surface?
Danubio works with founders and engineering leaders who need a senior team to own the system underneath the dashboard, the consistency of the numbers it shows, and the load it has to carry.
How the AI-powered search experience for BoldTrail and CORE Home was shipped to 400,000 agents in five months.
The original engineering engagement that grew into ownership of Inside Real Estate product surfaces.